A → B0
MOS1: 47.35 → 34.96 ks (−26.2%)
MOS2: 47.54 → 36.33 ks (−23.6%)
A strictly paired A/B0 experiment on CDFS 0108060601, with the M31CGM historical 3B/4 comparison: testing whether 2.1 filter→4.background is worth its extra GTI loss, and explicitly separating strictly paired evidence from historical product controls.
2.filter/allevc it used had already been cut to the standard GTI. The new selection page directly re-plots the native full/standard-selected FOV lightcurves saved in QDP, and strictly separates the GTI plot, the 2.1 histogram, and the standard QDP selection limits.
Open the M31 line-anchored 12 fail-closed case diagnosis →
Open the Al-anchored v4 gallery of all 60 MOS three-panel figures →
Open the 2.1c multi-strategy Pareto review page (GTI time × line-constrained continuum) →
Open the 0800730101 MOS2 multi-strategy GTI screening Pareto →
Open the fixed-frontier strategy transfer overview for 30 M31 MOS2 observations →
MOS1: 47.35 → 34.96 ks (−26.2%)
MOS2: 47.54 → 36.33 ks (−23.6%)
χ²Gehrels; reduced χ²=1.22, q=0.0093. This alone cannot be used to reject; per-spectrum residuals and contributions must be examined.
Display integral of the 0.4–6 keV flat-RSP; a detector-space diagnostic, not a calibrated photon flux.
This is a read-only comparison of M31CGM 080073*01 historical full-FOV MOS obj.pi spectra. The x-axis is 4.background, the y-axis is 3B.background; for each spectrum, the counts in RMF EBOUNDS channels lying entirely within 2–4 keV are summed and divided by EXPOSURE×BACKSCAL. If the extra filtering did not change the observed hard-band rate, points should fall on y=x; only points above the line indicate a lower raw rate in 4. Both x and y error bars are Gehrels 1σ approximations of the integrated counts.
All same-name 3B/4 obj.pi complete pairs are plotted; grey points are retained but carry a historical-product provenance warning.
Same BACKSCAL, mask Jaccard≥0.999, and shorter exposure in 4; shown as solid blue points.
Median 3B/4 rate of those 23 pairs; the median exposure ratio of 4 is 0.788. Losing ~21% of the time typically buys only ~1.1% rate difference.
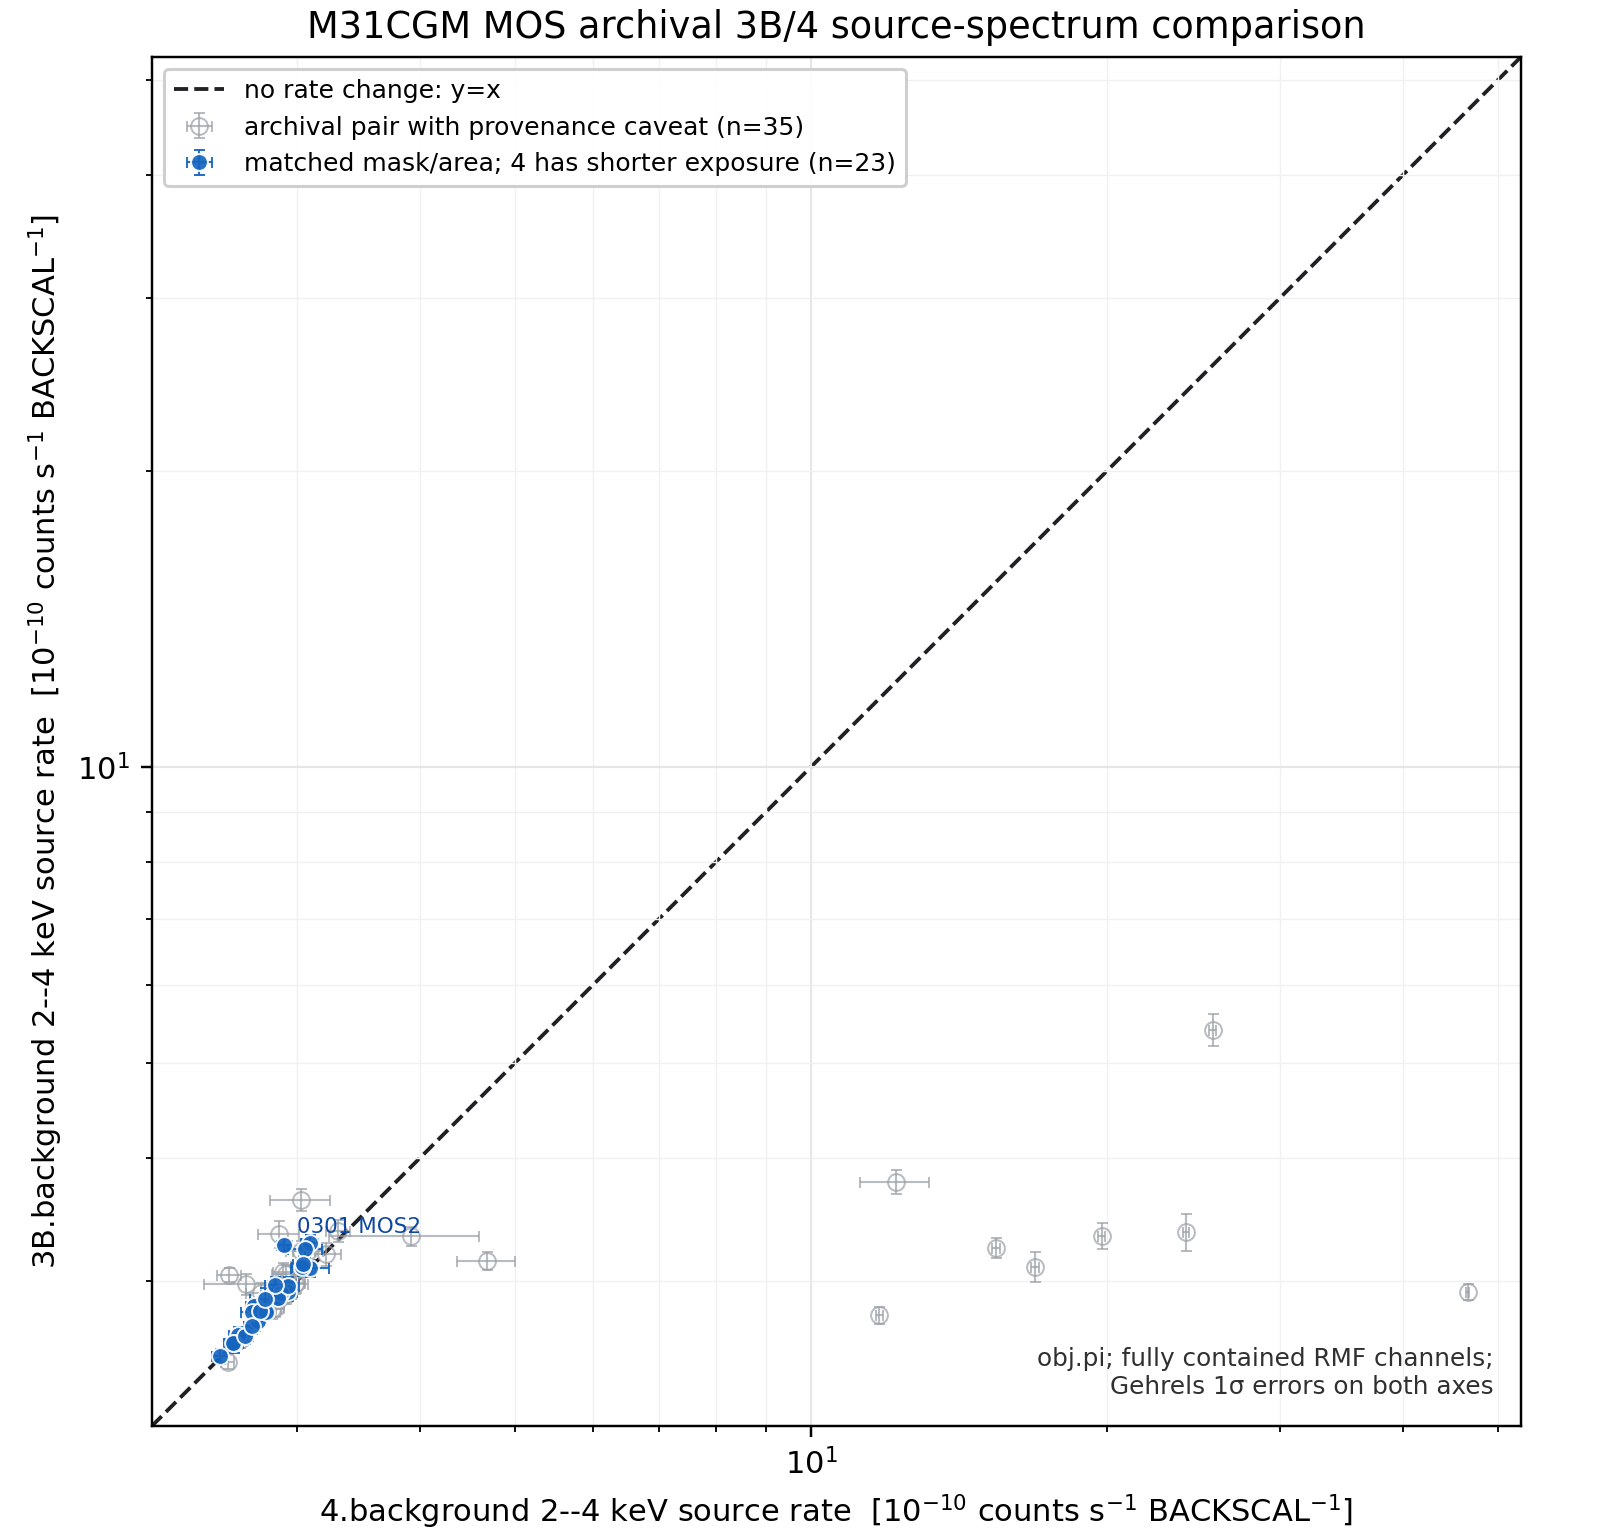
0800730301 MOS2 is the clear outlier: 3B/4=1.1199, about 5.18σ from the identity line. Click for the PDF.It answers "did the lost GTI buy a lower observed hard-band rate", and selects observations worth re-fitting. 0800730301 MOS2 is the historical case most worth following up with the same BPL-SP / released-sky strategy.
Raw source rate is not SP flux. It mixes sky photons, QPB residuals and SP; points above the line therefore cannot be called "everything removed was SP". M31 RMF EBOUNDS can be identical while the MATRIX differs, so subsequent fits must still use each lane's own response.
0800730301, the 2.filter/allevc events used by the old figure lie 100% inside the final 2.filter GTI, and 2.1.filter/allevc likewise lies 100% inside its own final GTI. The old lightcurve therefore lacks standard-rejected time and cannot measure the rate of the removed segments; the uncalibrated all-event − corner in it also cannot serve as a FOV−corner excess. The old 8/23, 6/23, 4/23 counts and correlation coefficients are no longer retained as conclusions.
The earlier "only 0800732701" conclusion described only the incomplete CDFS-side mirror. The authoritative remote data root actually retains all 30 080073*01 ObsIDs, both MOS cameras, both GTI sets, pre-GTI allevc/corner events and FOV/corner lightcurves: 60 temporal pairs in total. All GTIs are first clipped to the common finite event-time support, so that open-ended placeholder values in historical GTIs are not miscounted as physical exposure.
The y-axis is the 2.5–12 keV FOV-proxy difference, all-event − corner, of standard-only (removed by 2.1) time relative to shared (kept by both) time; positive values mean 2.1 did remove higher-FOV-proxy time. The x-axis is the 3B/4 2–4 keV raw source-PHA rate, with the right side indicating a lower rate in 4. Both axes carry statistical errors. Grey points retain historical aperture/product warnings; coloured points are the pre-defined strict 3B/4 comparable subset.
60 MOS temporal pairs are complete; 58 also have linkable 3B/4 PHA+response products.
8 pairs removed higher FOV proxy at >2σ; 6 pairs have 3B/4 raw rate >1σ above the identity line.
0301 MOS1/MOS2, 0501 MOS2, 2301 MOS2; the rest cannot serve as evidence of screening success.
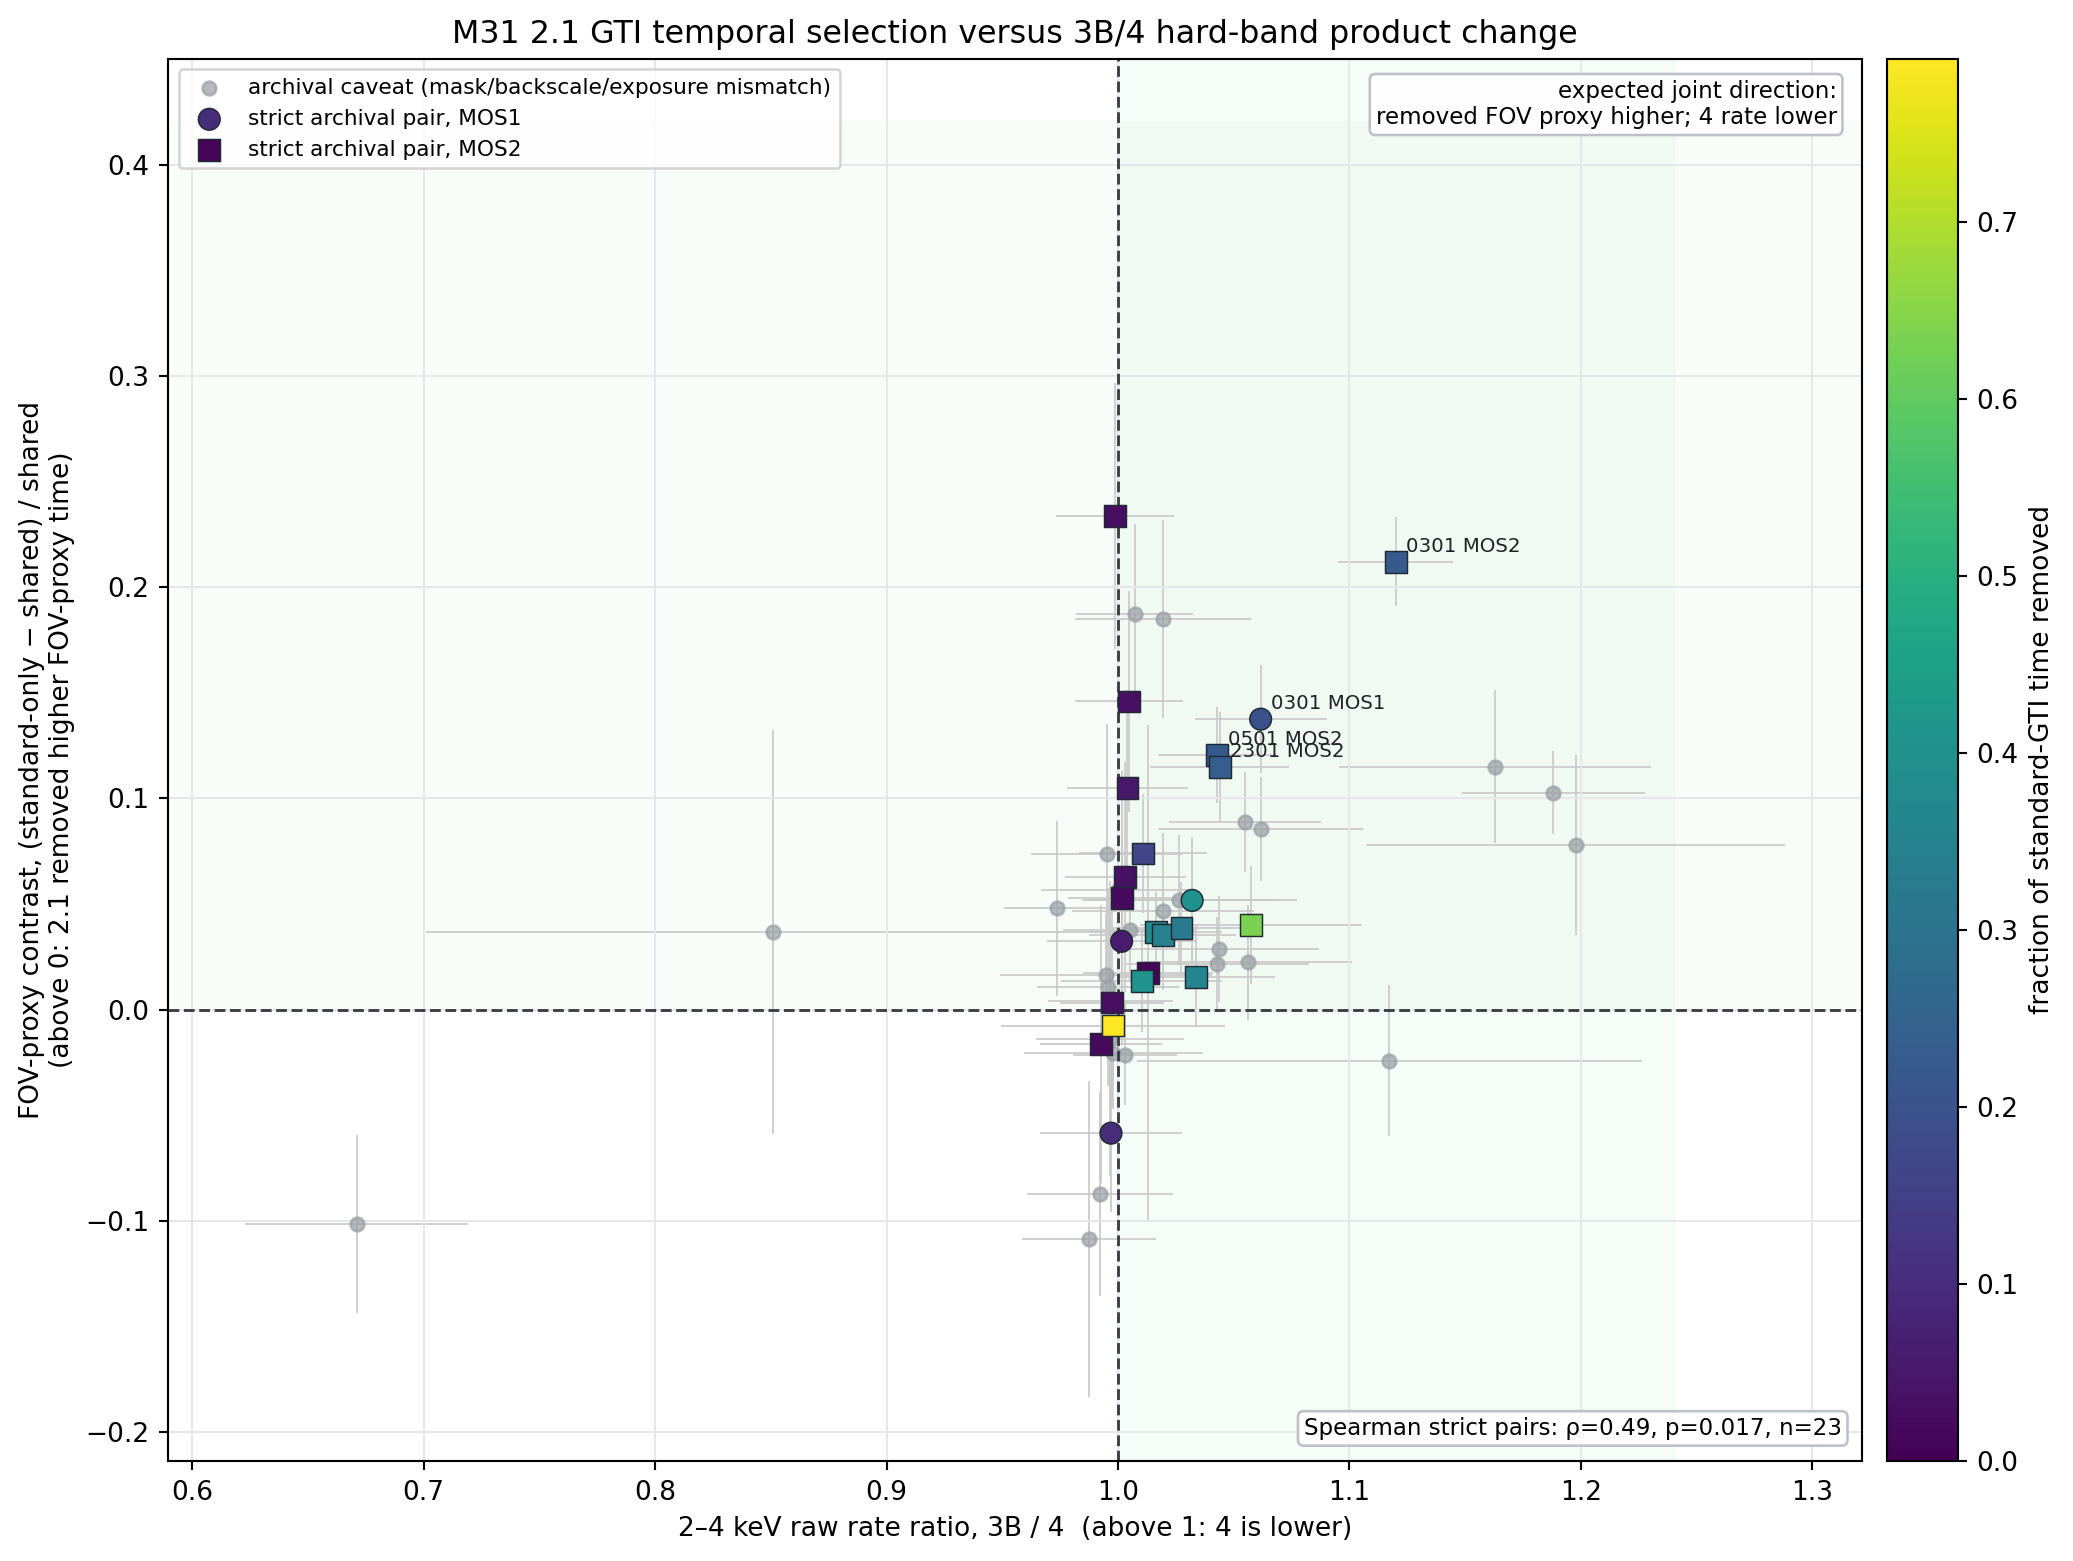
0800730301 MOS2 removed 22.1% of standard time; the removed-segment FOV proxy is 21.2% higher than the commonly retained segment (10.52σ), 3B/4=1.1199 (5.18σ), mask Jaccard=0.999547. MOS1 is in the same direction (13.7%, 5.53σ; 3B/4=1.0616, 2.23σ). This makes 0301 the most suitable follow-up BPL-SP / released-sky fit control.
0800730601 MOS2 removed segments with 7.4% higher FOV proxy (2.64σ), yet 3B/4=1.0108 (0.39σ); 0800731501 MOS2 has an even larger temporal difference (23.4%, 3.73σ) with no 2–4 keV rate drop. High-energy-rate selection is therefore a useful candidate indicator, but cannot replace SP fitting or sky-stability tests.
14 of the 23 strict pairs contain small amounts of 2.1-only time (max 240 s), so the two GTIs should not be presumed strict subsets. The comparison here uses the actual intersection and difference of the two GTIs, rather than forcing 2.1 to be a subset of standard.
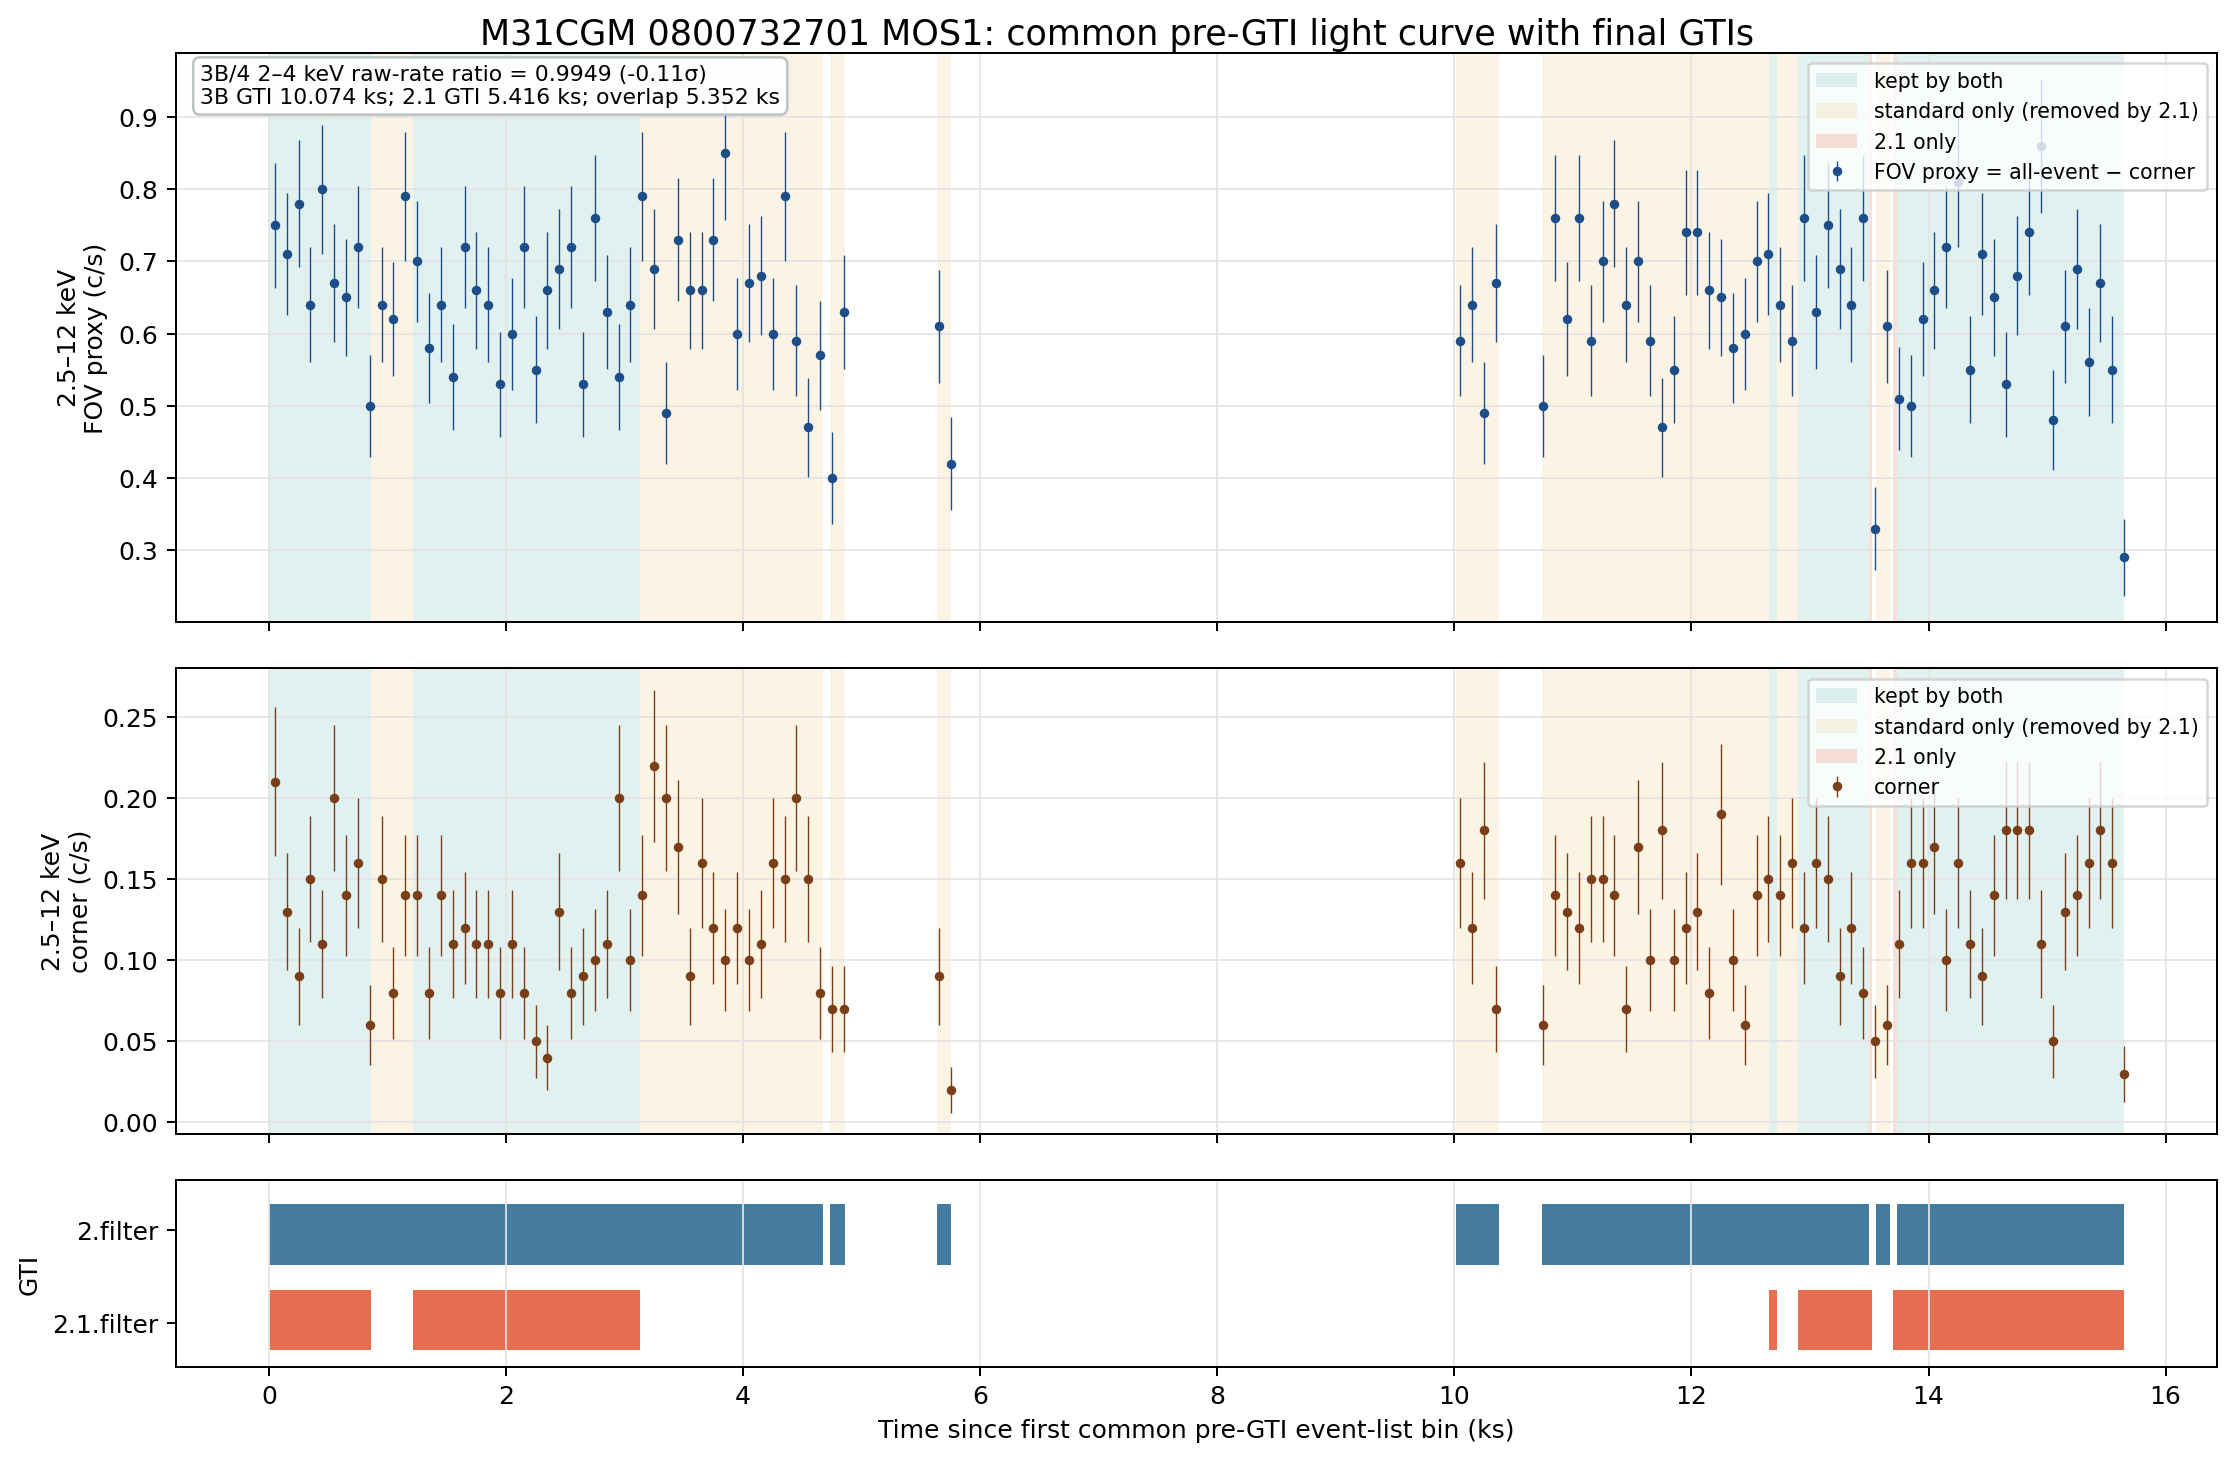
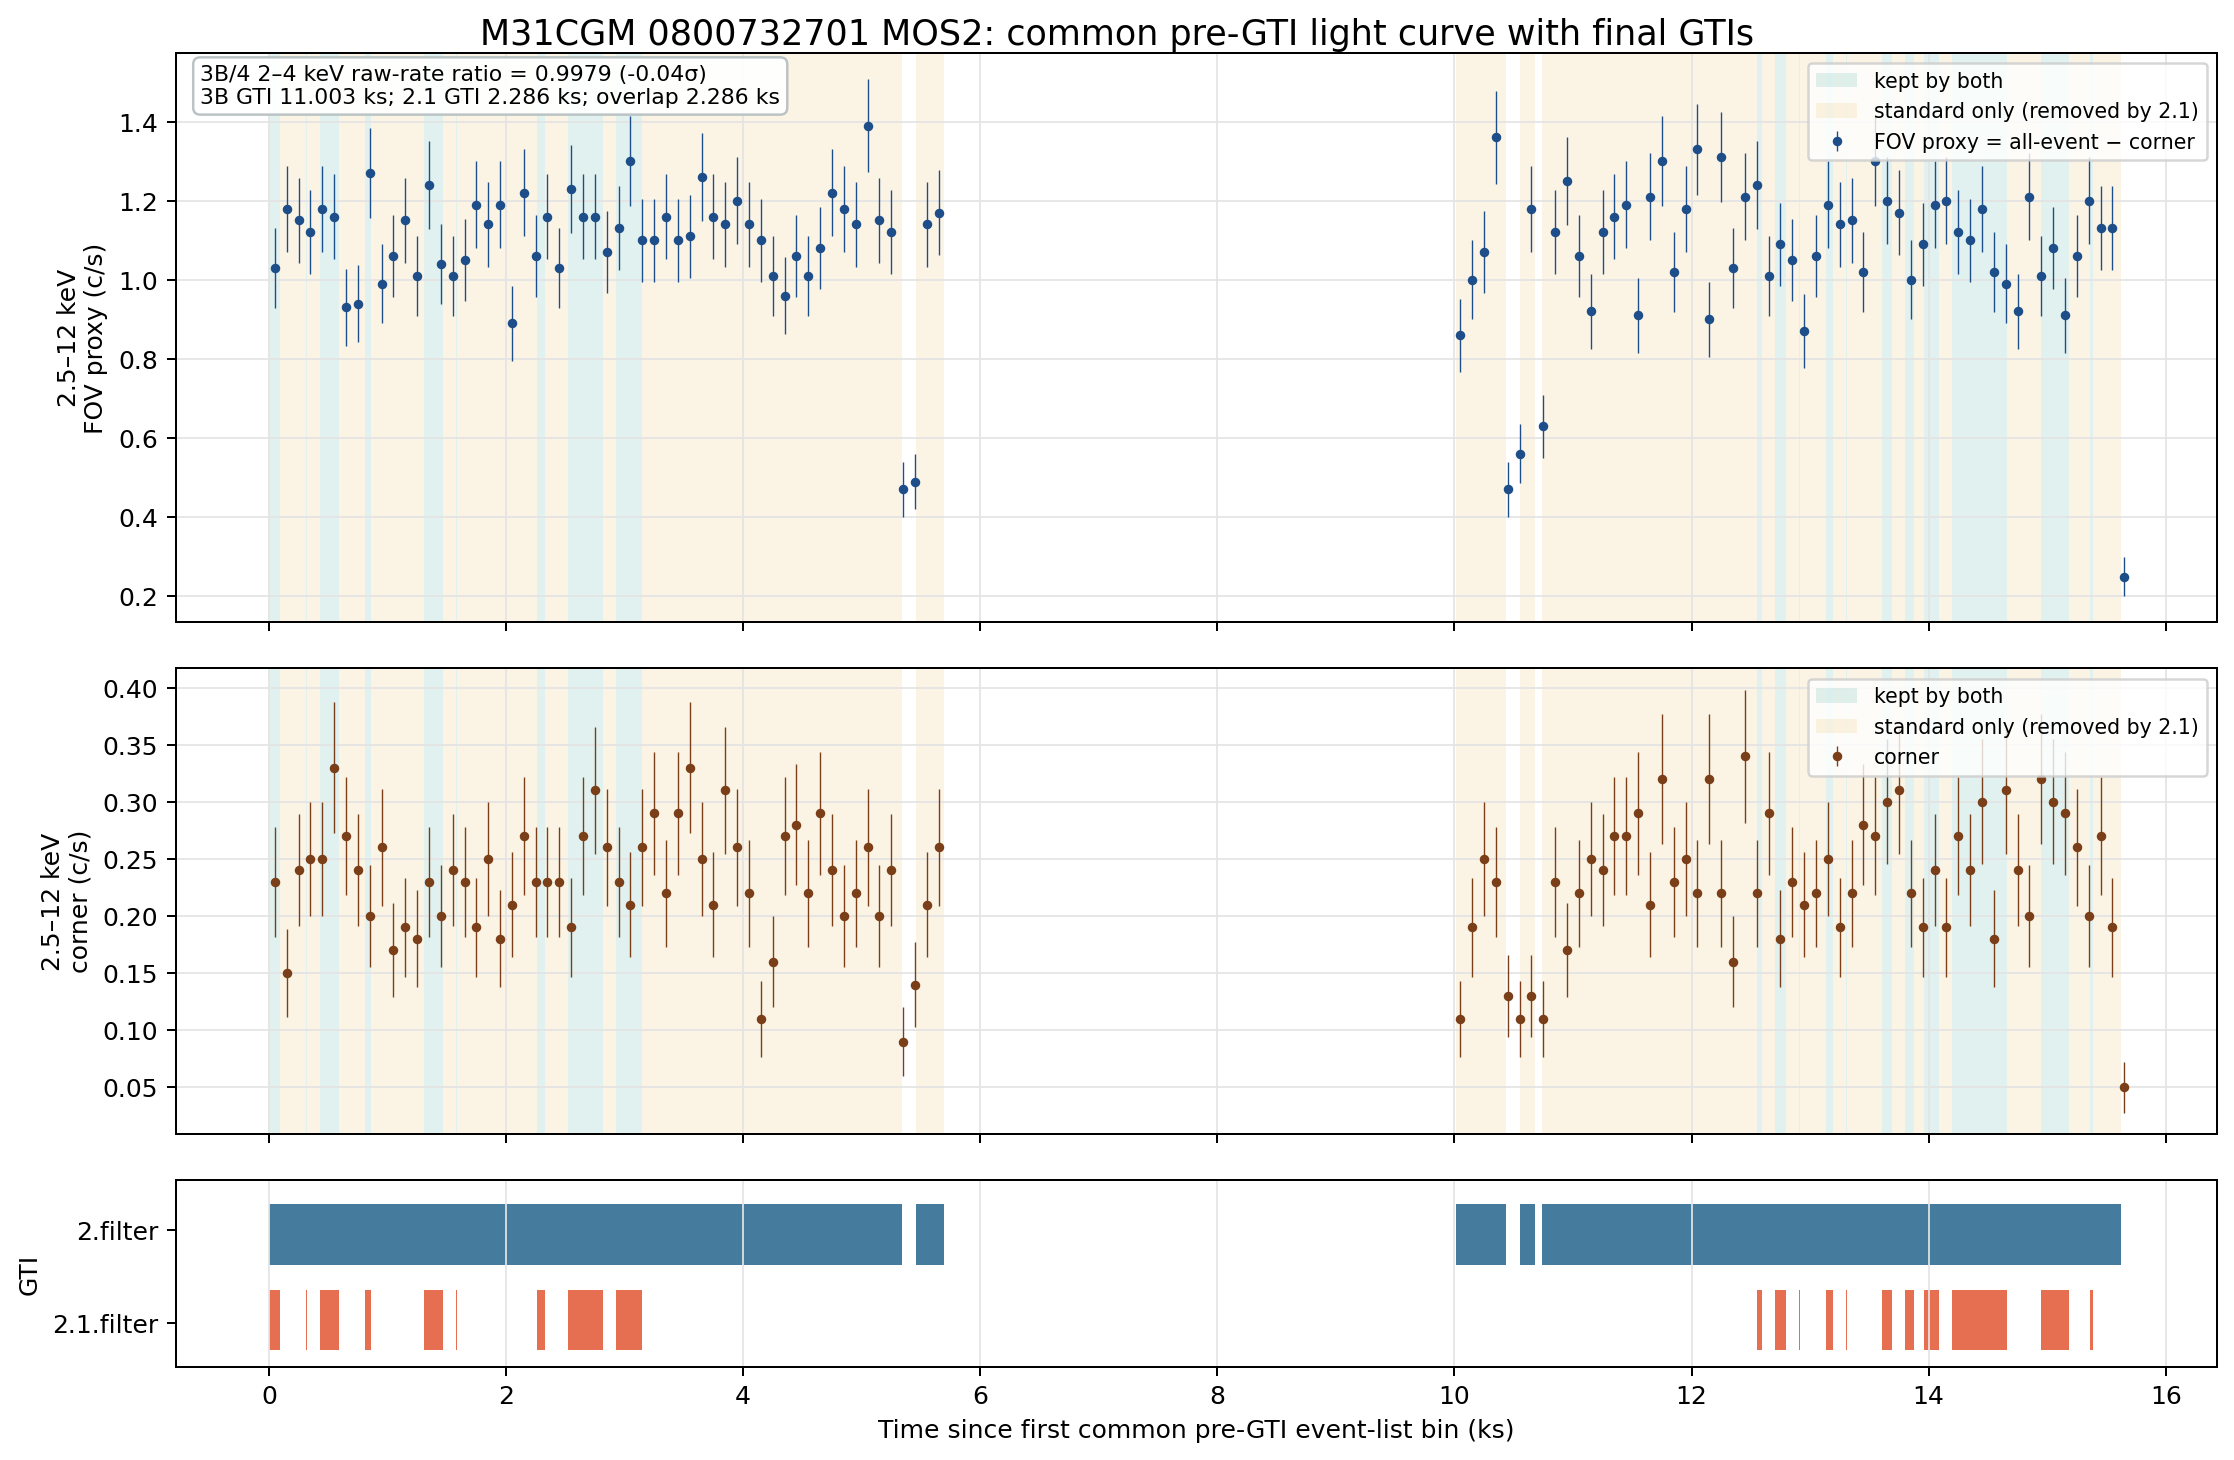
Open the 60-lightcurve gallery (each ObsID shows MOS1/MOS2 together)
Each figure is rebuilt from the 2.filter pre-final-GTI event list on the same 100-s grid; green is time kept by both GTIs, yellow is standard-only, and the bottom shows the final GTIs. The 3B/4 in the figures is raw source-PHA rate, not SP flux.
Four MOS spectra overlaid in one common coordinate systemResiduals carry Gehrels vertical error barslog y lower limit = 3×10⁻⁶
The upper panel overlays A MOS1/MOS2 and B0 MOS1/MOS2 in a single spectral coordinate system; same-colour data and total models can be compared directly. LHB, absorbed halo, absorbed CXB, Al-K, Si-K and the flat-response BPL-SP are all computed from the current set_full_model and displayed. The lower panel is likewise a single shared residual coordinate: each point's error bar is the normalized ±1 Gehrels data statistical error, excluding model covariance. The vertical dashed line is the fixed 3.2 keV BPL break.
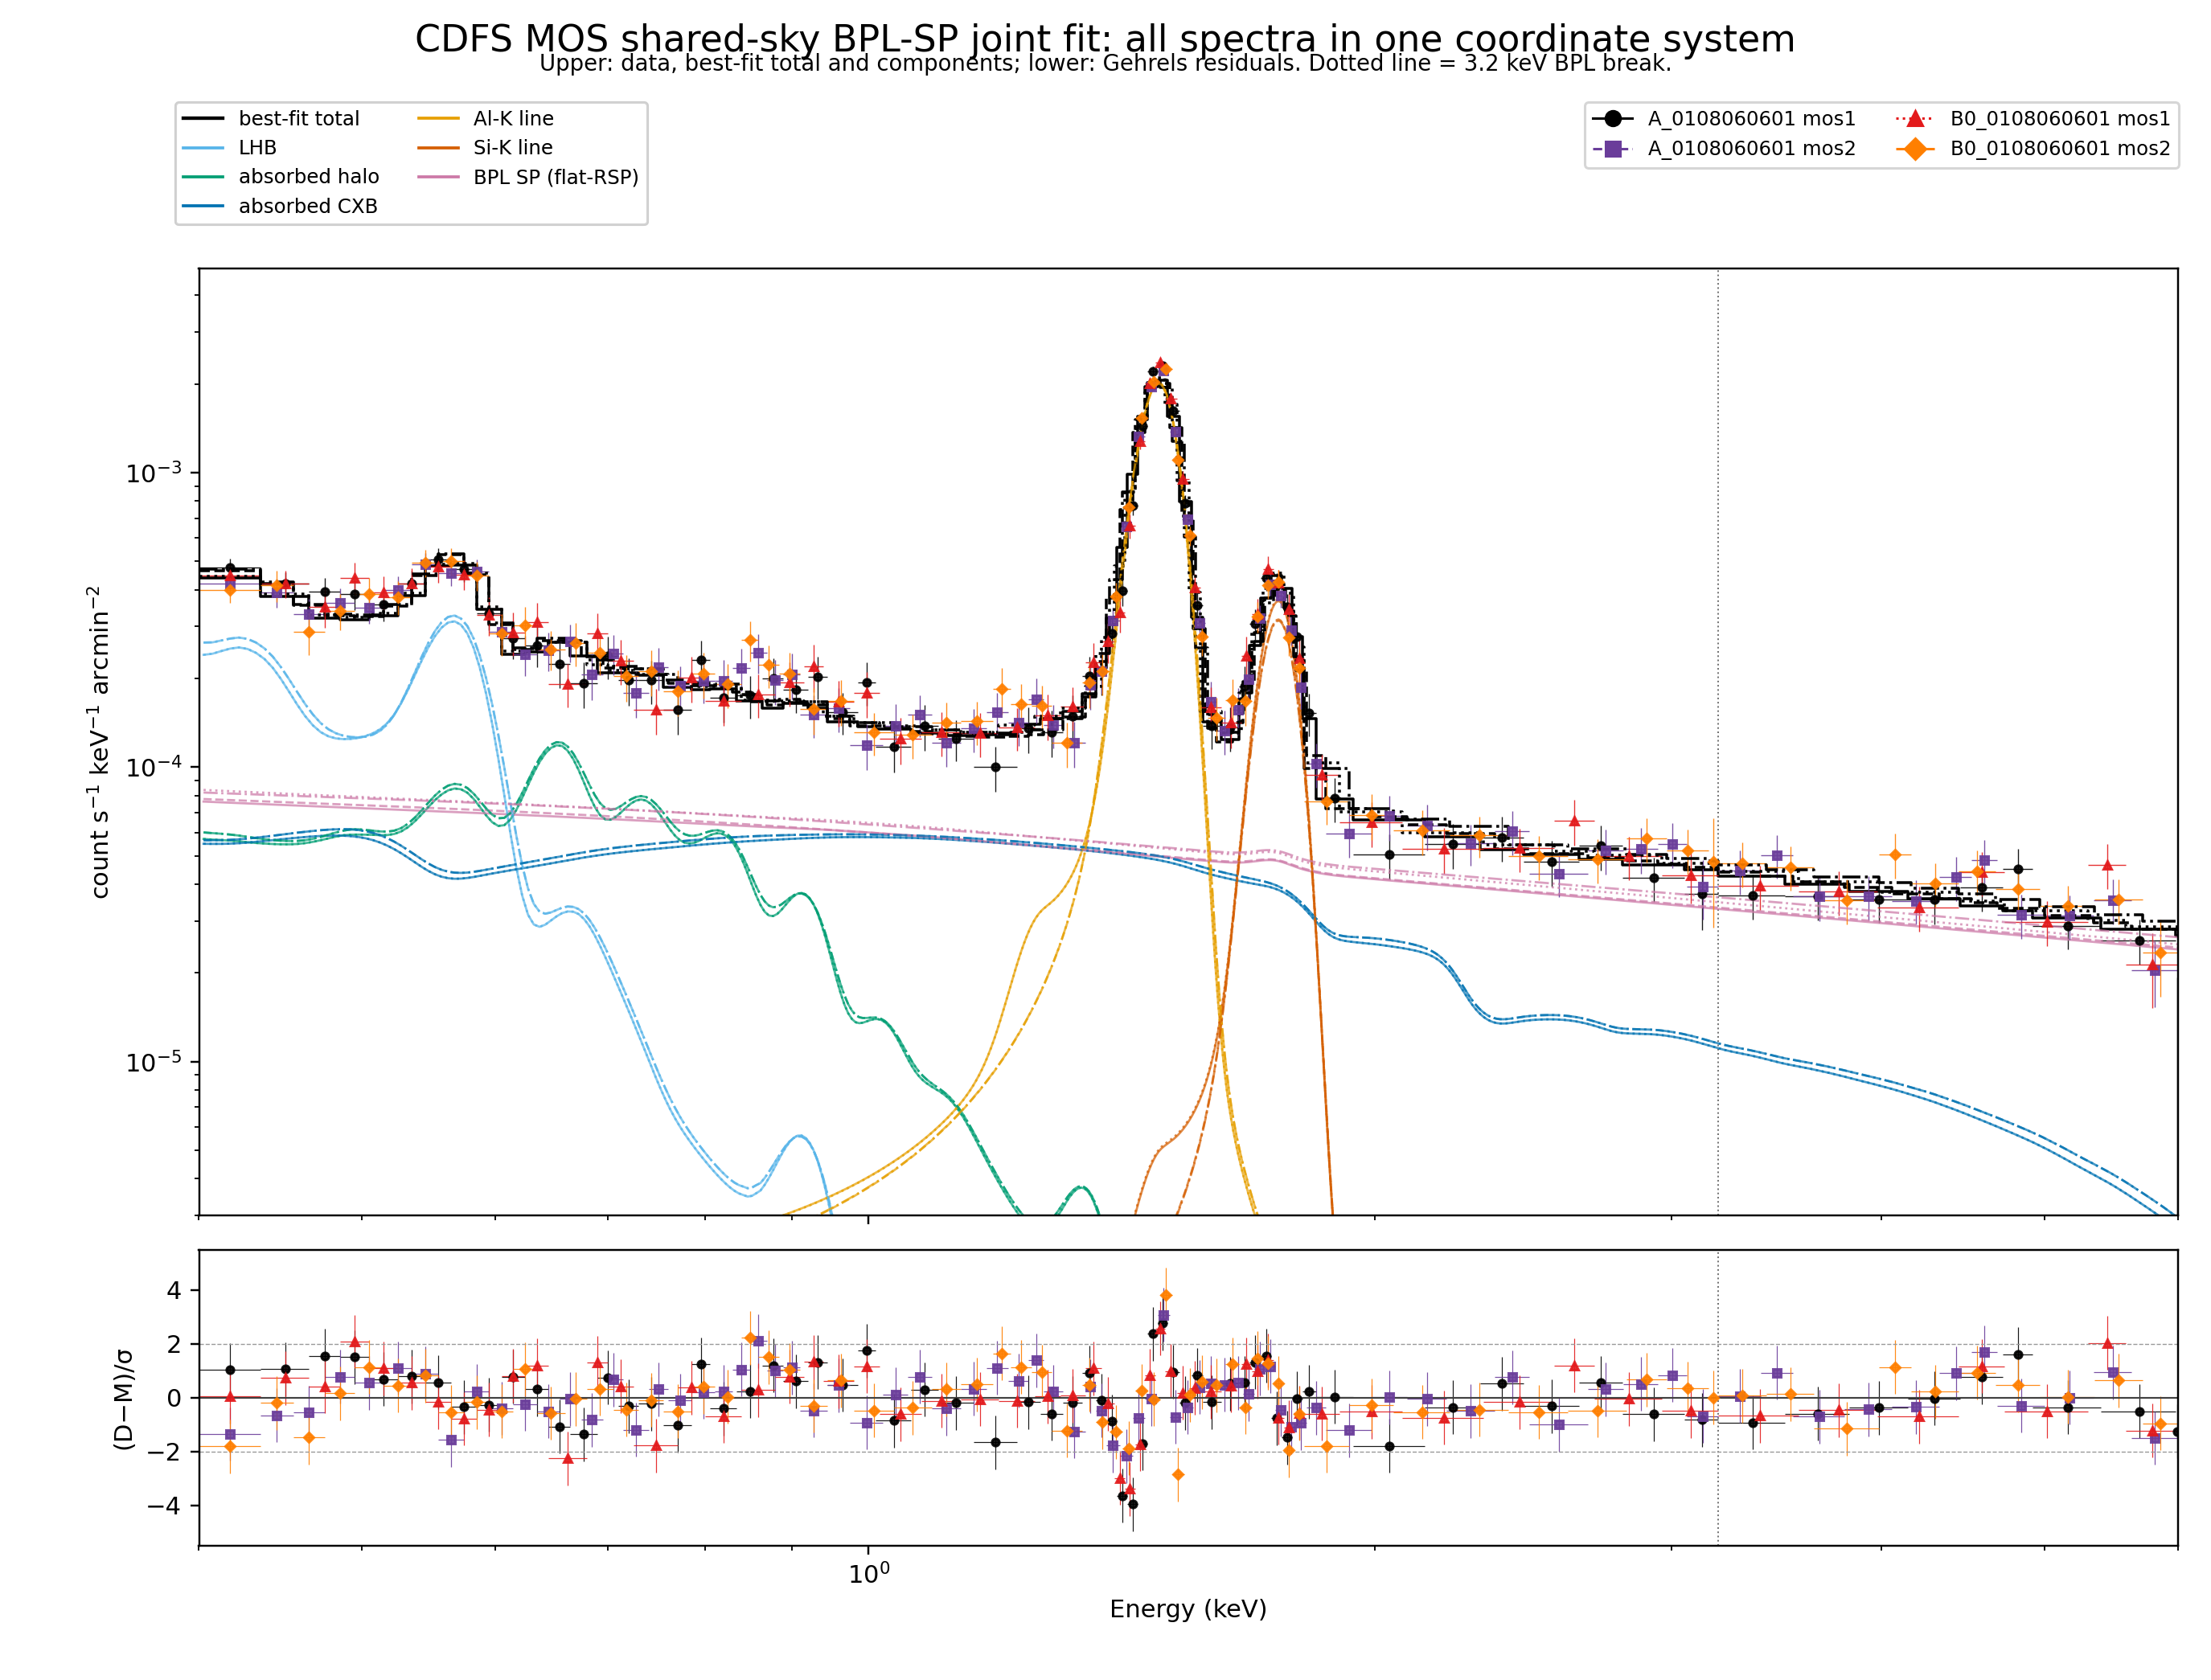
Shared sky parameters cannot be arbitrarily attributed to any single spectrum. The local dof in the table only subtracts that spectrum's final 4 detector-space free parameters; χ² contributions are additive and suitable for locating the source of residuals.
| Spectrum | χ² / bins | local dof | χ² / local dof | BPL-SP 0.4–6 keV pseudo-flux |
|---|---|---|---|---|
| A MOS1 | 94.44 / 69 | 65 | 1.45 | 2.1230×10⁻⁴ |
| A MOS2 | 64.65 / 77 | 73 | 0.89 | 2.1463×10⁻⁴ |
| B0 MOS1 | 76.27 / 60 | 56 | 1.36 | 2.2549×10⁻⁴ |
| B0 MOS2 | 75.75 / 69 | 65 | 1.17 | 2.3082×10⁻⁴ |
No spectrum is pathological; the largest local ratio is 1.45 for A MOS1, not B0. The slightly worse overall reduced χ² of B0 is therefore not caused by one obviously abnormal spectrum. Judgement should continue from the continuous residual structure in the figure, not from the global number alone.
index1 < index2 to the set minimum separation (about 0.5 and 0.5001). This means the current data cannot identify the required break curvature; the BPL degenerates to an approximate single power law here.chi2gehrels.xsbknpower, BreakE=3.2 keV fixed, independent per spectrum with enforced index1 < index2; displayed with flat-RSP.skyarea as a Python scalar, checked before the first optimization, and used in both the RSP and flat-RSP terms.Replicate 0108060701 with the same frozen pipeline, then decide whether to design 2.1b. The improved success criteria should be pre-registered as: under the same sky model and mask, B0/2.1b retains reasonable GTI relative to A, while the residual BPL-SP decreases, and the released-sky result does not deviate from the joint solution; looking at removed time or reduced χ² alone is not sufficient.