Figure-led tutorial · group meeting
Single-observation Pareto GTI:
line constraint and continuum invariant
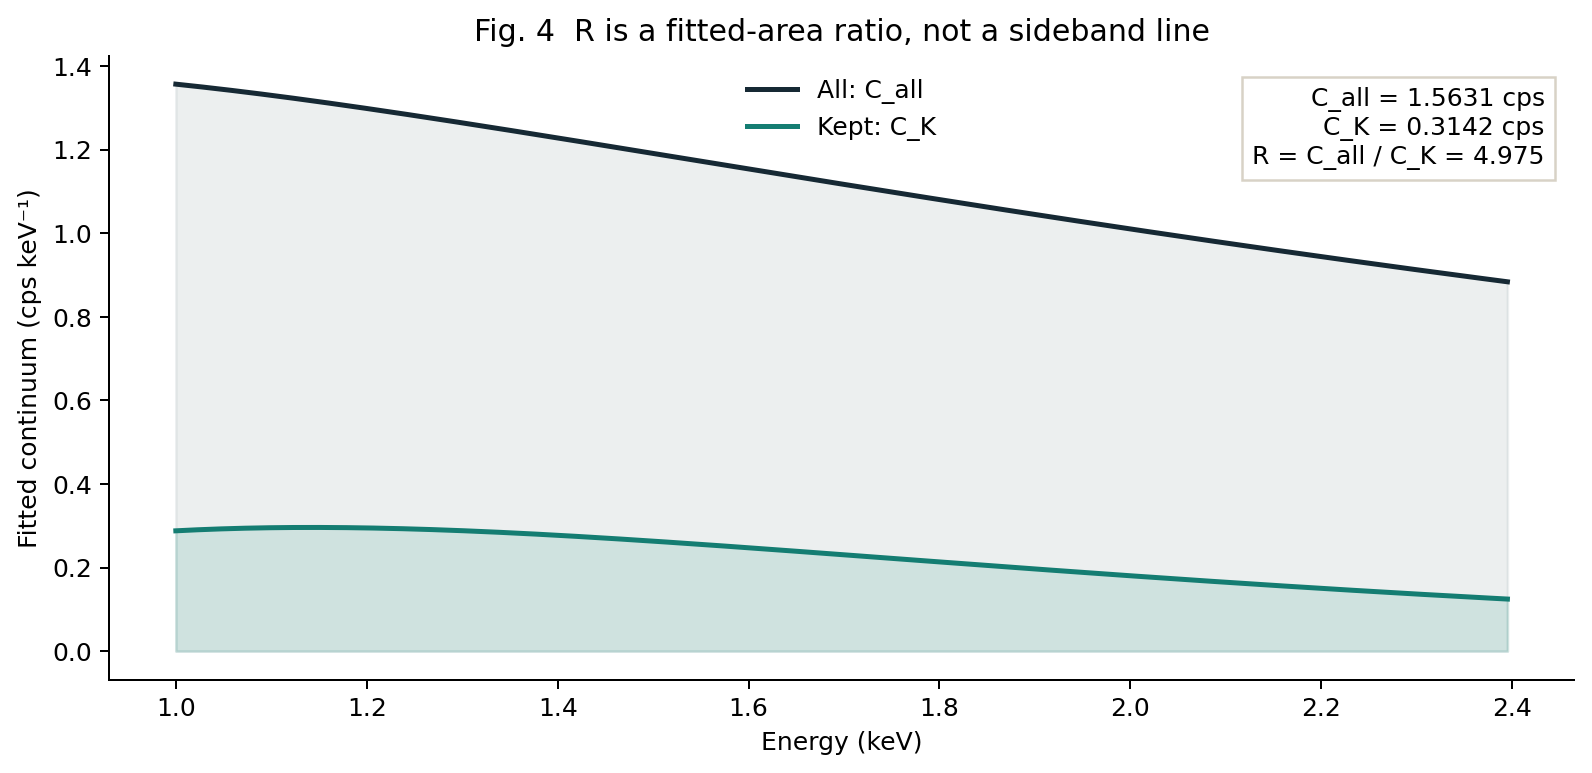
In one sentence: for one observation, find the Pareto frontier of retained live time \(T_K\) and continuum reduction \(R=C_\mathrm{all}/C_K\) subject to \(L_\mathrm{all}=L_K\).
The FOV light curve constructs the GTI; CORNER is diagnostic only.
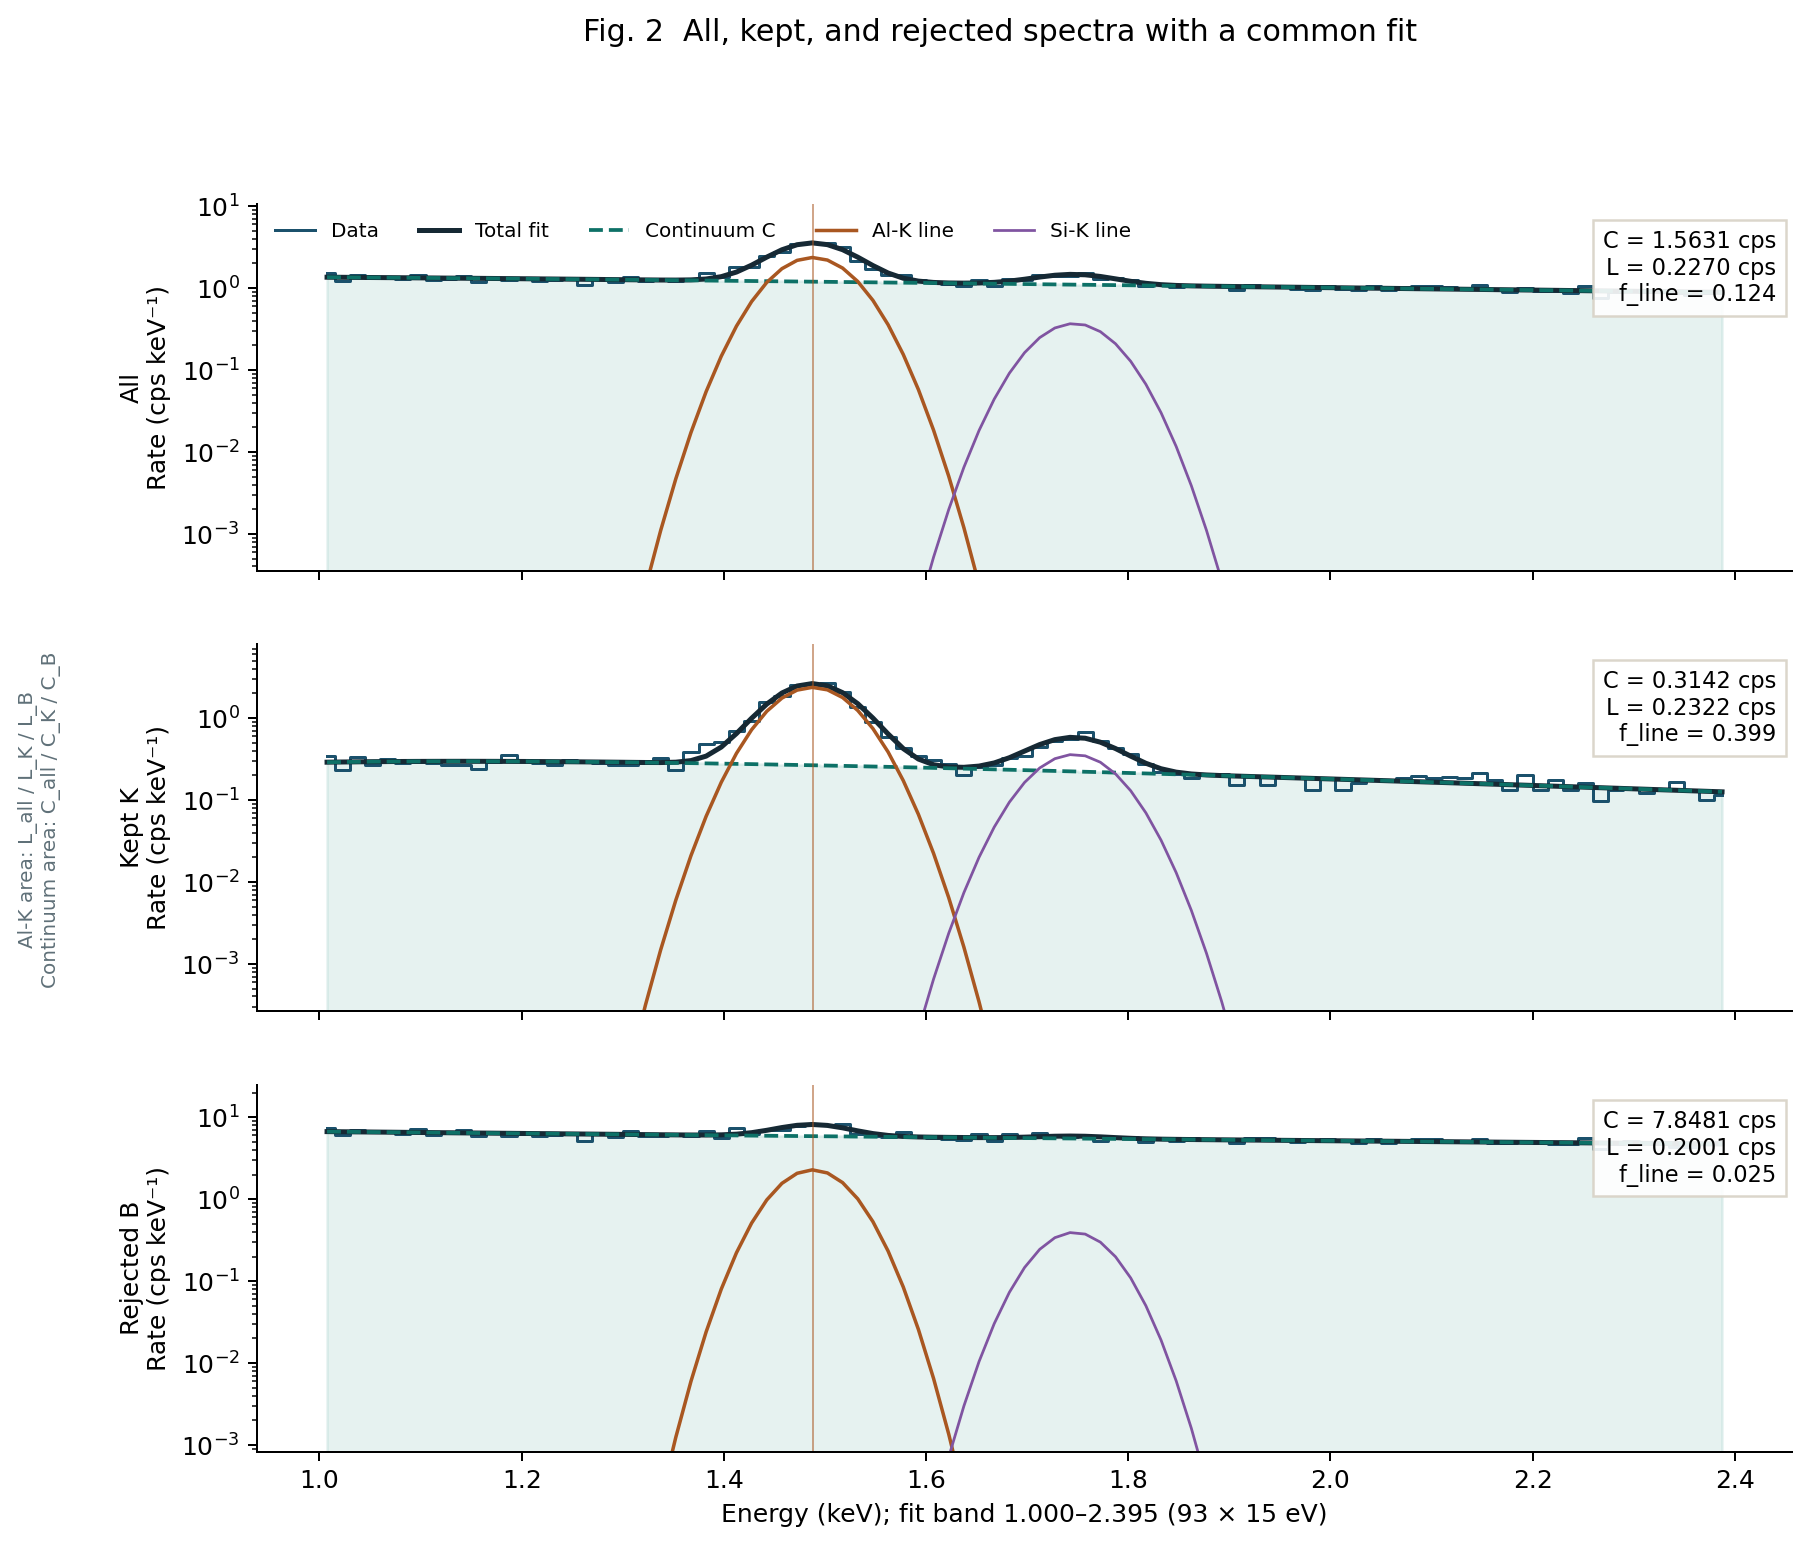
93 15 eV bins; Al-K=1.4879, Si-K=1.7466 keV.
\(f_T=T_K/T_\mathrm{all}\) and \(R\); averaging or ranking across observations is forbidden.
Part 1 · anatomy
1. First split one observation into all, kept, and rejected
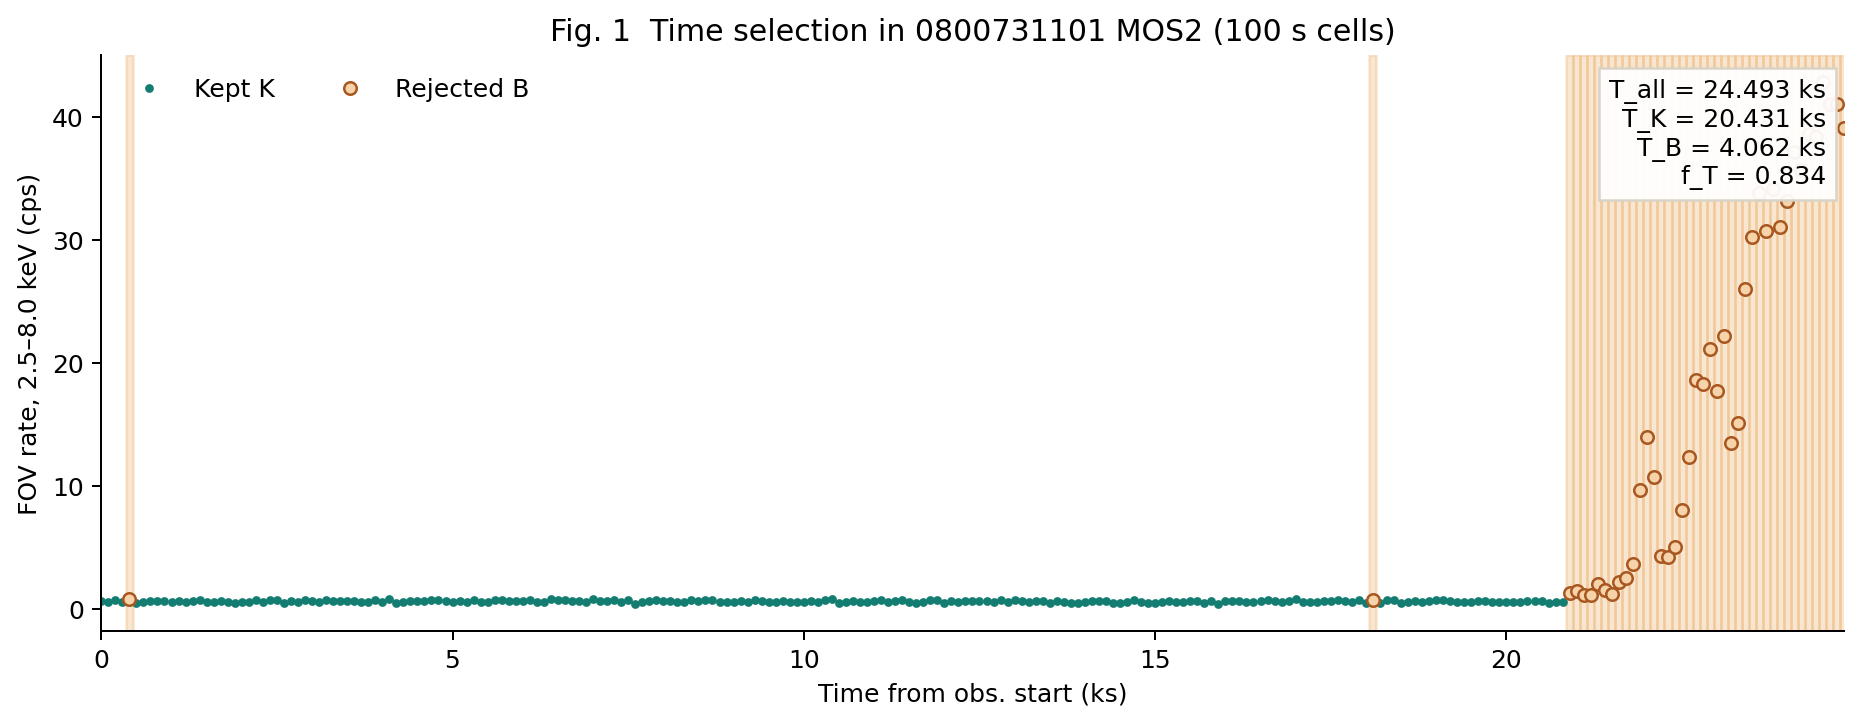
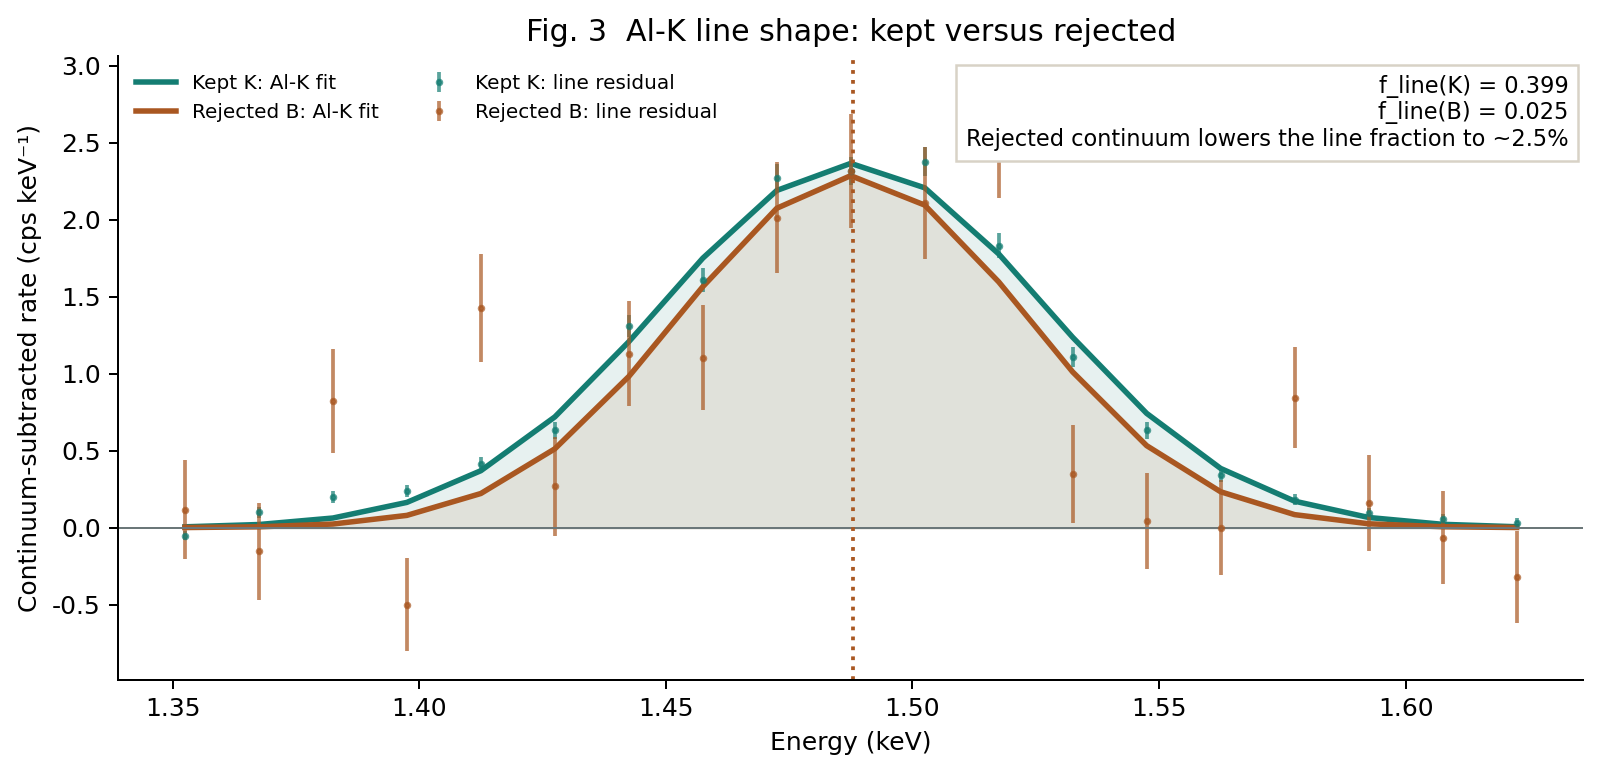
The next four figures use the strong-flare observation 0800731101 MOS2. Each 100 s cell gets its live time from the segment-by-segment sum of TIMEDEL × FRACEXP; containing events does not imply a full 100 s.
Part 2 · constraint
2. The line that makes R meaningful also blocks score gaming
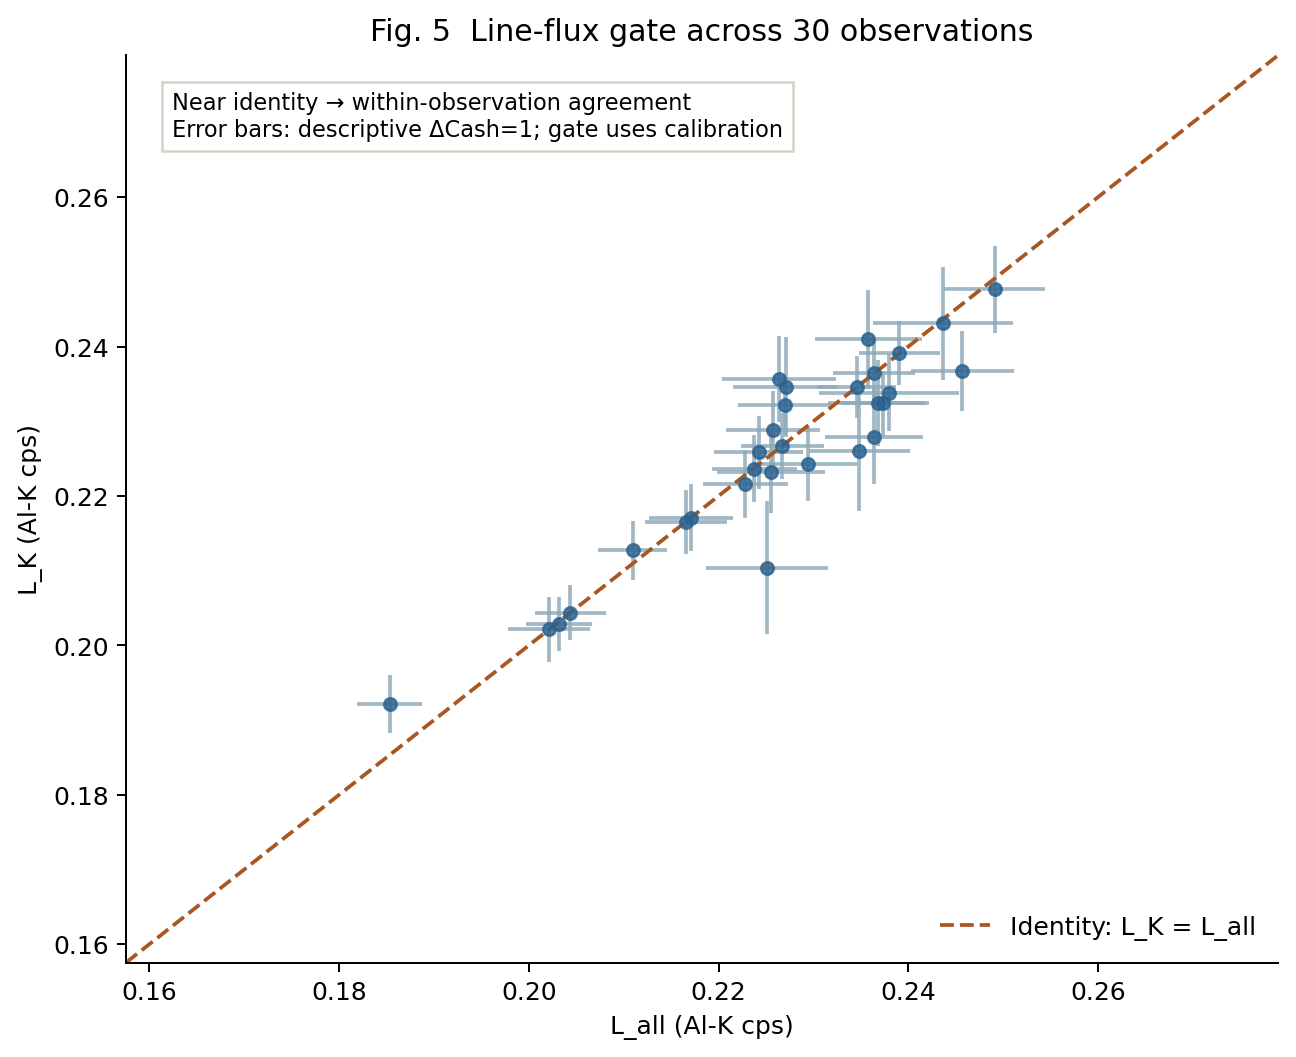
Maximizing \(R\) means lowering the continuum while preserving the all-interval Al-K line only when the line-flux conservation gate holds. Since \(L_K-L_\mathrm{all}=(1-f_T)(L_K-L_B)\), more aggressive cuts make the gate more necessary and increase its testing power at the same time.
Wording boundary
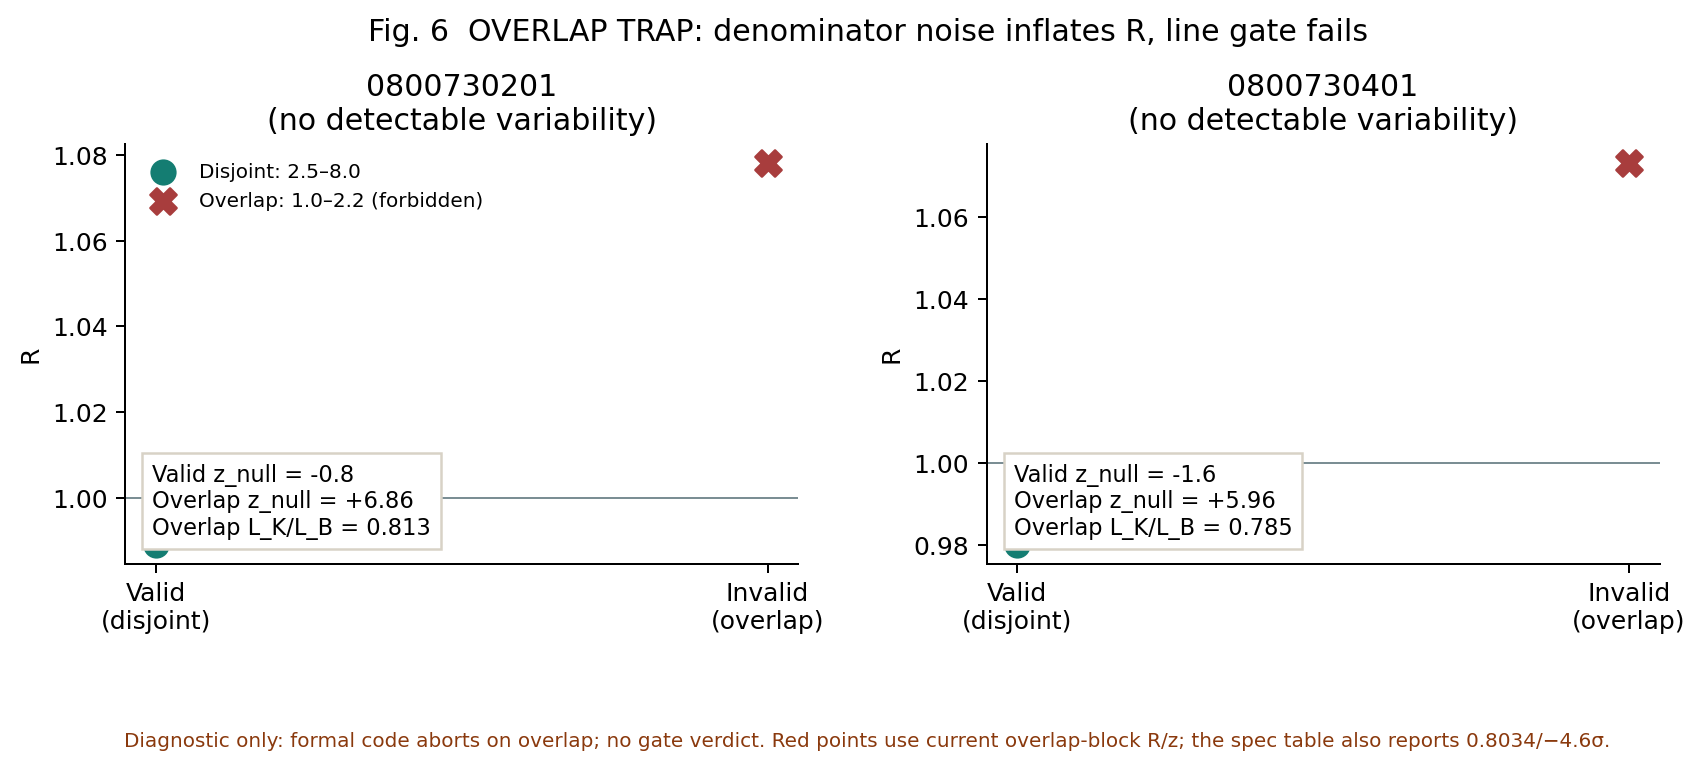
“No detectable variability” does not mean “no soft protons”: 0800730201 still has a small transient focused soft-proton signature, while steady soft protons remain by construction in \(C_\mathrm{all}\) and \(C_K\), invisible to \(R\).
Part 3 · frontier
3. A curve is not a frontier: strategy structure must differ
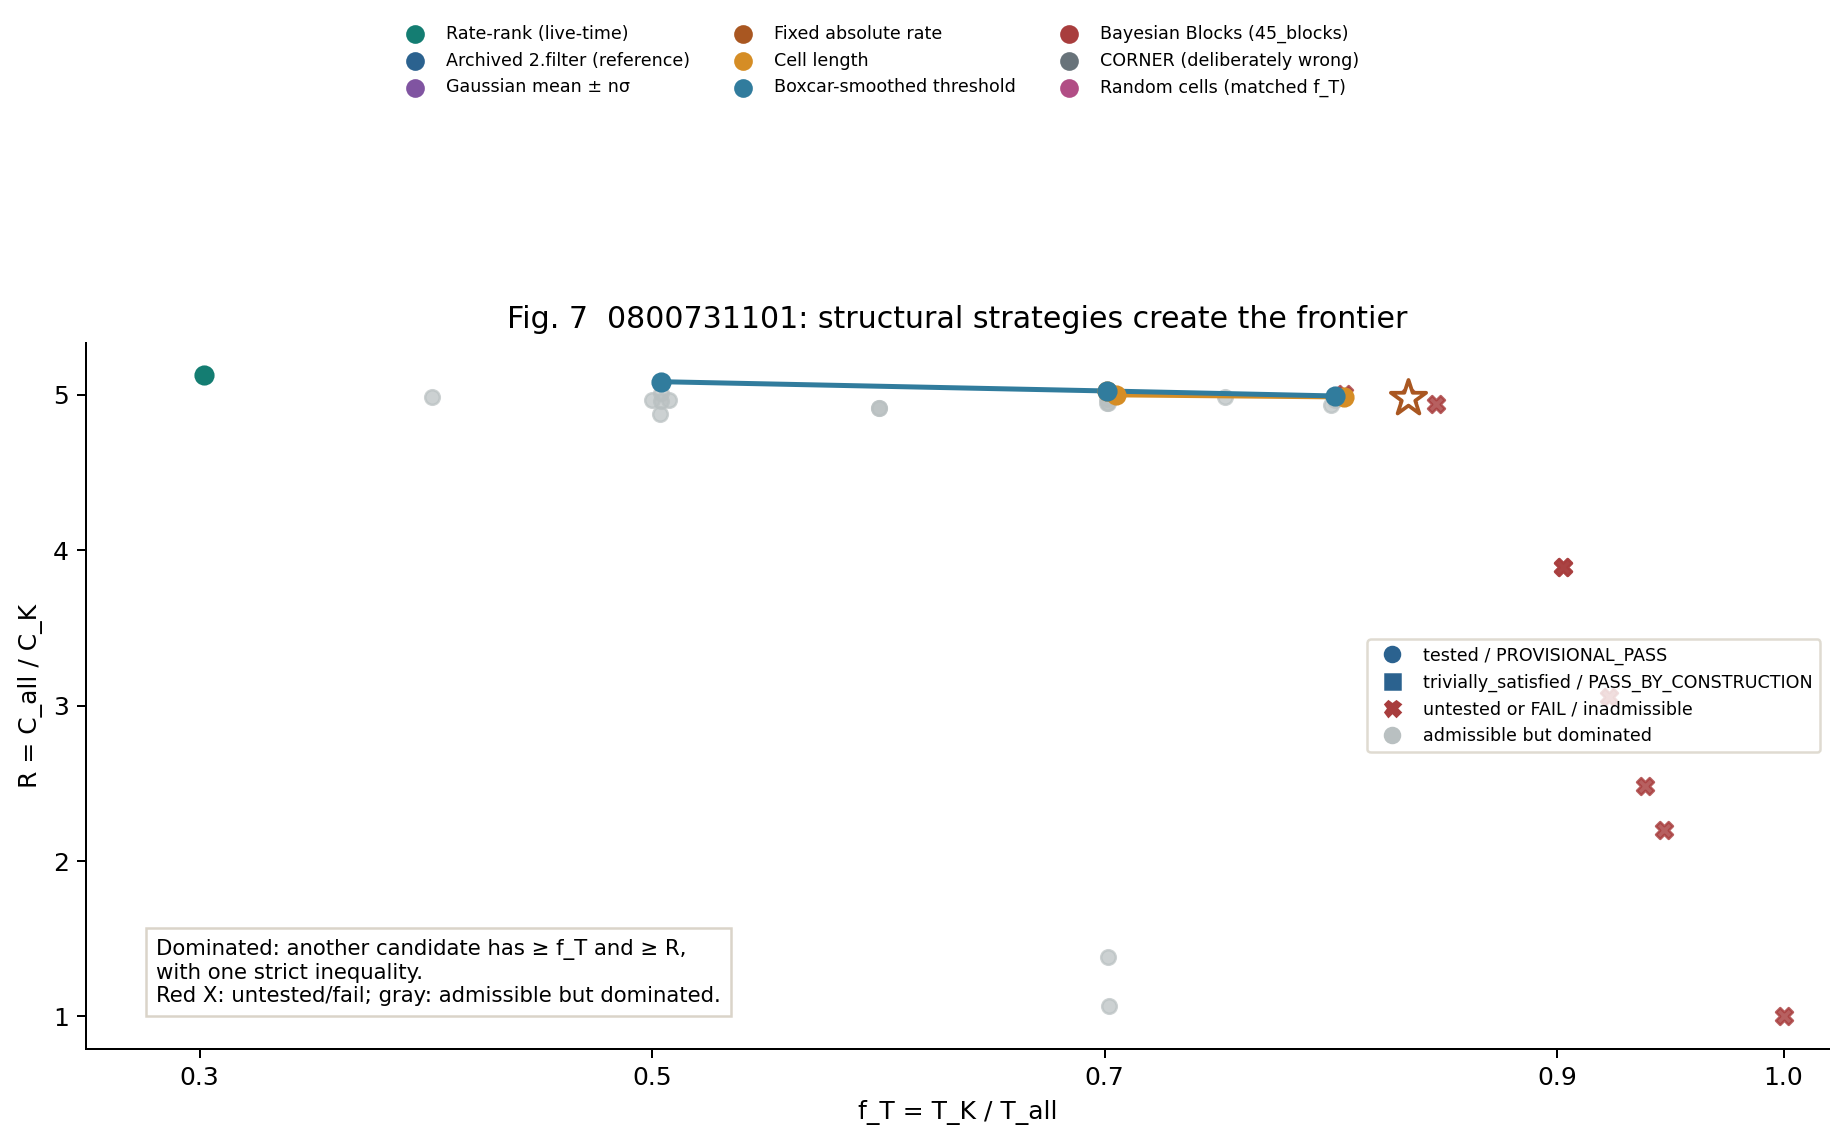
Changing only the retained fraction under one rate-rank rule usually produces a monotone curve, with no necessarily dominated point. This page therefore constructs 33 candidates on 0800731101 (25 new structured candidates), adding cell lengths, smoothing, histogram cuts, fixed-rate thresholds, Bayesian Blocks, CORNER, and a random baseline; every candidate refits K/B and carries a gate class and verdict.
| Strategy family | Count | Definition |
|---|---|---|
| rate-rank (measured live time) | 8 | \(f_T=0.30,\ldots,1.00\); existing rule. |
| Archived 2.filter (reference) | 1 | Star in the figure; not a new strategy family. |
| Gaussian mean ± nσ | 3 | \(n=1.5,2,3\); keep cells within the histogram mean ± nσ. |
| Fixed absolute-rate threshold | 3 | Thresholds come from this observation's measured-rate quantiles and are not transferred across observations. |
| Different cell lengths | 9 | 50/200/500 s, each at \(f_T=0.5,0.7,0.8\). |
| Boxcar-smoothed threshold | 6 | Smooth 5/11 original 100 s cells, each at three target fractions. |
| Bayesian Blocks | 1 | 45 event-time blocks, retaining about 0.70 by block rate. |
| CORNER selection (deliberately wrong) | 1 | Rank by the corner curve; used only to show the wrong direction. |
| Random cells (matched \(f_T\)) | 1 | Random-rate ranking to about 0.70; a dominated lower bound. |
| Candidate | \(f_T\) | \(T_K\) (ks) | \(R\) | gate class / verdict |
|---|---|---|---|---|
| rate-rank 0.30 | 0.3021 | 7.399 | 5.126 | tested / PROVISIONAL_PASS |
| cell 200 s, 0.70 | 0.7011 | 17.173 | 5.024 | tested / PROVISIONAL_PASS |
| cell 200 s, 0.80 | 0.8059 | 19.739 | 4.985 | tested / PROVISIONAL_PASS |
| cell 500 s, 0.70 | 0.7052 | 17.273 | 4.998 | tested / PROVISIONAL_PASS |
| smooth 11 cells, 0.50 | 0.5038 | 12.341 | 5.083 | tested / PROVISIONAL_PASS |
| smooth 11 cells, 0.70 | 0.7012 | 17.175 | 5.023 | tested / PROVISIONAL_PASS |
| smooth 11 cells, 0.80 | 0.8020 | 19.644 | 4.991 | tested / PROVISIONAL_PASS |
The deliberately wrong CORNER strategy (\(f_T=0.7014,R=1.383\)) and the random matched strategy (\(f_T=0.7017,R=1.066\)) both lie below the frontier, as expected. They remain visible as wrong-choice and noise-floor gray points.
Part 4 · boundaries
4. Put the boundaries beside the conclusions
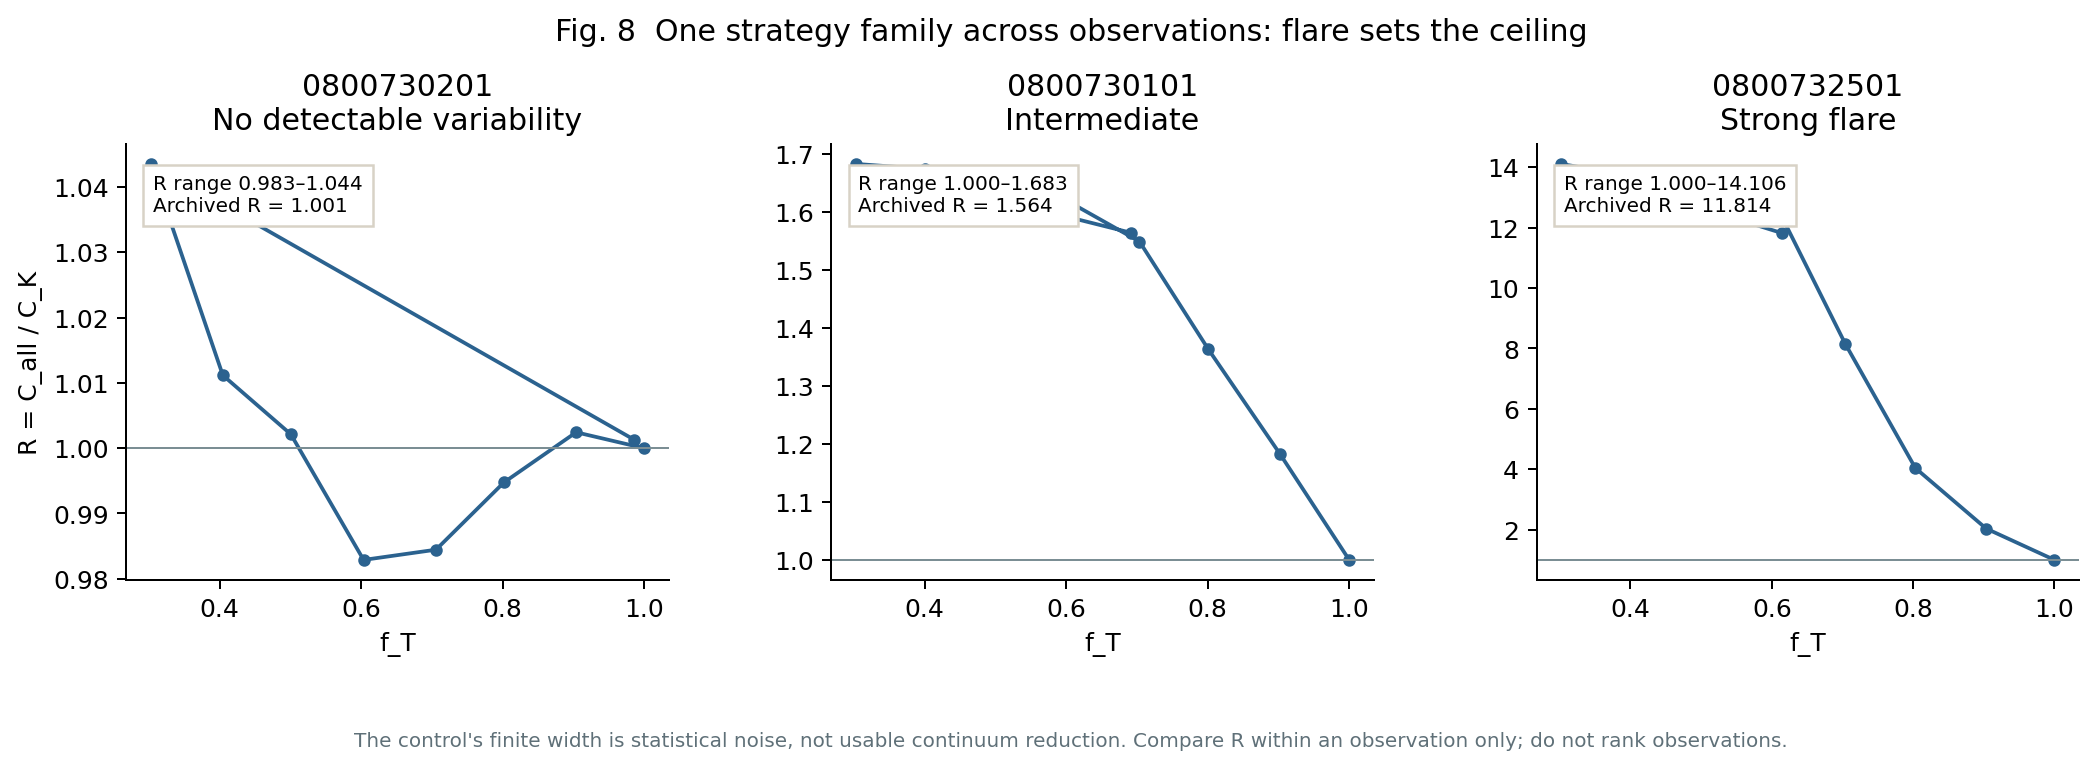
R is not comparable across observations
The ceiling of \(R\) is set by how flared the observation happens to be, not by how good the strategy is. Therefore \(R\) must never be averaged, ranked, or pooled across observations; frontiers are drawn per observation and only their shapes compare. It is not a soft-proton removal fraction.
Steady soft protons are invisible
A steady component raises the all and kept continua together, so \(R\) can remain near 1; this framework therefore does not measure absolute SP counts.
R does not resolve bad CCDs or compact variables
Fault-injection receipts show that they can drive \(R\) to about 4σ while the gate remains near 0. Independent CCD and spatial screening is required.
The gate verdict is provisional
The implementation records line–continuum coupling \(s=-0.01284\pm0.00394\) and \(s\lambda\) for every candidate, but the frozen adjudication does not apply the correction.
Two questions remain open
- How should the direction and size of the line–continuum coupling correction ultimately be applied? Controlled injections give a negative slope, but the corrected full sample still shows about −2.2 to −2.5σ line loss, which could mean Al-K changes with particle flux or could indicate a second unmodeled system.
- Al-K being stable in a linear-average sense does not mean that one observation lacks slow temporal structure; corner-particle rate must be tested as an independent probe.
Three takeaways
First, \(R\) is a fixed-reference coordinate only within one observation. Second, the line both defines the gate for continuum reduction and prevents rate selection from turning noise into gain. Third, the frontier must come from structurally different strategies, and every point must carry a gate class and verdict.